
Technical Details of Our Indoor Navigation Application, Selected as the University's Best Graduation Project
- What is Literature Review?
- 1) Location Determination
- 2) Information on the Distance of Modems from Stores
- 3) Signal Strength Variability
- 4) Multiple Stores Being Equally Distanced from a Modem
- 5) Distances and Neighborhoods Between Stores
- 6) Directing the user to the store they want to visit.
- 7) Voice Guidance
- 8) Potential Improvements
- Conclusion
- References
Contents
- What is Literature Review?
- 1) Location Determination
- 2) Information on the Distance of Modems from Stores
- 3) Signal Strength Variability
- 4) Multiple Stores Being Equally Distanced from a Modem
- 5) Distances and Neighborhoods Between Stores
- 6) Directing the user to the store they want to visit.
- 7) Voice Guidance
- 8) Potential Improvements
- Conclusion
- References
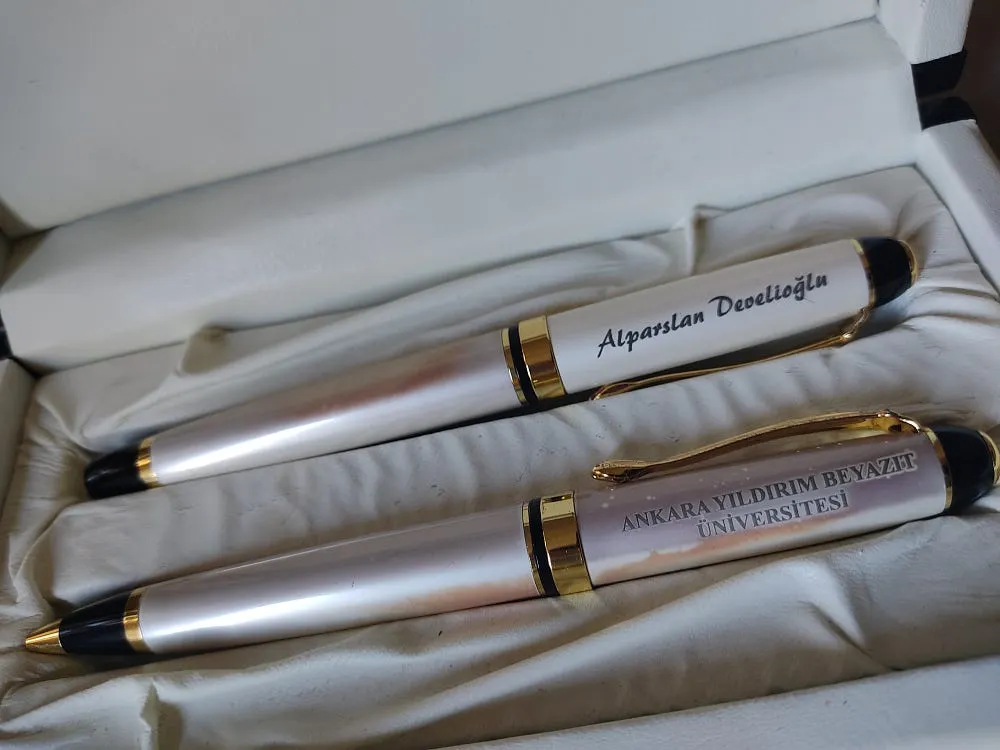
Image by author
Hi everyone. In this article, I will thoroughly examine and explain the technical details of our graduation project, which we completed in our final year of Computer Engineering (English) at Ankara Yıldırım Beyazıt University, for those who are interested. I will start with how we began the project and end with the presentation we gave to our professors. If you have a headache, you can also read my article on natural ways to relieve your headache.
The project was designed to provide indoor navigation. The goal was to enable visitors to navigate between stores without getting lost, especially in large and complex indoor spaces like shopping malls. When visitors select the store they want to visit via the application, their current location is determined, and the shortest route is calculated using Wi-Fi signals within the shopping mall.
What is Literature Review?
The first stage of a graduation project is literature review. First, you research and gather information on questions like, "Are there similar projects to yours? What kind of projects are they; are their topics and results the same? Are there any articles or papers on the subject? How did those who did it do it, what difficulties did they encounter, and how did they overcome these difficulties?" You then show this information to your professor who is supervising the project in its initial stages.
At that time, in 2015-2016, there wasn't a single indoor navigation application developed for enclosed environments where GPS didn't work, such as airports, shopping malls, and hospitals. Google was working on a project for airports, but there was only an animated commercial and nothing concrete. It was later cancelled. There was so little information about this project that it wasn't even featured on killedbygoogle.com. Of course, there were some scientific articles, but they were all theoretical, and we couldn't find a single working project.
Now, almost a decade later, when I research this again, I see some examples: Google Indoor Maps, InMapz, Path Guide, Situm Mapping Tool, Anyplace, Indoor Service, IndoorAtlas… I haven't tested how accurately they work.
A project about "determining a user's location inside a building via their mobile device and guiding them to their desired destination via a mobile application" will face many challenges, as I mentioned in the first article. Now let's examine in detail how my wonderful team and I overcame those challenges:
1) Location Determination
Back then, to determine location inside buildings, beacons were installed, one for every 5-6 square meters. If I remember correctly, they cost $5 each, and you needed many of them, not just three or five. From what I quickly gathered, as of October 2024, the price ranged between $8-10. Unfortunately, the university didn't support this cost. We also couldn't reach an agreement with the shopping mall management because we couldn't know how accurately they would work and there would be many financial problems, such as invoicing. There were different models that ran on batteries or rechargeable batteries. Maintenance was also problematic, as you can imagine. We were students, we didn't have a company or anything; starting a company was very difficult and costly back then. So we overcame the problem of determining location within the building using modems.
Now you can even start a company from where you're sitting, via the internet. My student friends reading this, don't hesitate to start such a project after doing some good literature research. So, why am I not getting into this now? I really don't know, we'll see in time. 😂
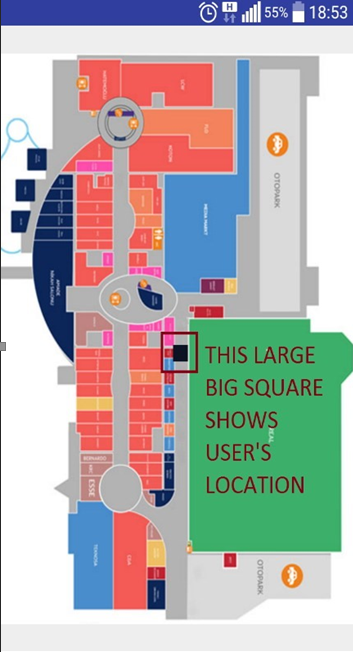
Screenshot taken by the author ten years ago: shopping mall floor plan.
2) Information on the Distance of Modems from Stores
WiFi modems are devices with a MAC address, which is a unique identification number. In Android, we can gather a lot of information about the modem using the WiFiManager, ScanResult, and ConnectivityManager classes. After obtaining this information, we can calculate the distance of our user's mobile device from the modem using the Free Space Path Loss (FSPL) formula, which calculates distance from signal strength (dB), as shown below.

Image by Author
d: Distance in meters
f: Frequency in Hertz
32.44: This is a constant value used when distance is in kilometers and frequency is in megahertz.
FSPL (dB): Expresses the path loss the signal undergoes during propagation in free space, in decibels.
I was so excited when I discovered this formula. I didn't have any programming classes that day. I didn't even go to university. On an autumn day when the leaves were starting to fall in Gençlik Park, in the study room of Block B of the Ankara KYK Yunus Emre Student Dormitory, I quickly wrote a simple application, coding only this formula.
There was no obstacle between me and the modem, and my distance from it was 5 meters. I automatically re-ran the formula with every change in signal strength. I also wrote another algorithm to determine how accurate the formula was by comparing the calculated distance to the actual distance of 5 meters. Back then, Kotlin wasn't the official language of Android. I wrote the application in Java. Oh, those were the days!
I left the application open and running, and I studied for another class until evening. My reason for making this measurement and writing the algorithm was to check the accuracy of the distance calculated by the formula due to the variability in signal strength.
Based on my tests with the modems in the dorm, I could determine that the formula's accuracy was around 60-70%. It showed a distance that was actually 5 meters as 4 meters, sometimes 2 meters, sometimes 8 meters, and sometimes 10 meters, even without any walls in between.
These values were absolutely insufficient for selling a product to a customer. In fact, this rate was far too low even for an academic study.
What would you think if you went to a shopping mall as a customer, downloaded its mobile app, but found that the app only worked with 60% accuracy, your distance to the stores constantly changed, and your location appeared in random places every 10 seconds?
At this point, I understood that this project would be very challenging, but giving up and choosing another graduation project topic while there was still time never even crossed my mind.
Far from discouraging me, the difficulty only whetted the appetite of my nature, which enjoys challenges, and made my mouth water.
3) Signal Strength Variability
One of the biggest problems encountered when locating in buildings and similar enclosed spaces is signal strength variability, as mentioned in the previous point. Whether you use a modem or a beacon, signal strengths are variable. Even if you remain stationary and the modem doesn't move, the modem's signal strength constantly changes within certain values. To overcome this difficulty, we measured the shortest and longest distances between stores using modems.
You might ask, "What does the distance from the modem to the store have to do with signal strength?" The modem is stationary, but the store is an area. Let's consider a shopping mall. We all know how large the stores can be. Therefore, the distance of an area from a fixed point cannot be expressed with a single value; this distance changes depending on which point in the area is considered. The distance calculated from the signal strength is also obtained within the shortest and longest distance range we determined. Thus, while solving the problem of determining the distance between an area and a point, we have also solved the problem of signal strength variability, albeit not completely.
When there was a wall or an obstacle that significantly reduced signal strength, the calculated distance could vary greatly. In such cases, we didn't include that modem in our database at all.
How we measured the shortest and longest distances between stores and modems was, as you might expect from this super trio (I'm talking about our three-person project team; be sure to read the previous article).
We wrote a separate mobile application that calculated and recorded the distance in our database. With our phones in hand, we waited in front of the stores one by one, opening our distance-measuring application. We waited for the application to measure, calculate, and record the shortest and longest distances for the five closest modems to our phones three or five times.
Imagine: Three young people waiting five or ten seconds in front of each store before moving on to the next one… Why five different modems? The answer is in the next section.
4) Multiple Stores Being Equally Distanced from a Modem
The information about which modems are how many meters away from which stores is the most important data in this project. To illustrate how we solved this, we can use the method mobile operators use to locate a user. In the trilateration method, the distances of a person to the three closest points are taken into account. Trilateration is the process of determining the location of an unknown point based on the locations of three known points.
If a user is 5 units away from a base station, the user can be at any point 5 units away from that base station. As we know from mathematics, if we connect all points equidistant from a point, a circle is formed. Since there are infinitely many points on a circle, the user can be in infinitely many different locations.
If we look at the distances of the user to two different base stations, the number of possible locations is reduced to two. This is because two circles intersect at two points under suitable conditions. When we look at the distances to three different base stations, the common intersection point of the three circles determines the user's location.
Let me explain triangulation better with a simple example: Suppose the three modems closest to a user are AP1, AP2, and AP3, as shown in the image below. There is only one point where the user can be simultaneously 6 meters from modem AP1, 4 meters from modem AP2, and 2 meters from modem AP3.
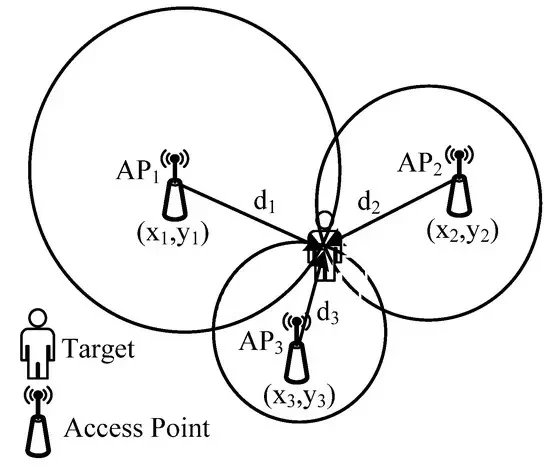
Image created by author
Although triangulation was very helpful, the accuracy wasn't as high as we wanted because the signal strength was variable. So we decided to try the same logic with five modems. This way, we accounted for the possibility of one or even several modems being disabled, turned off and on, replaced, malfunctioning, or experiencing momentary drops in signal strength. The system was able to produce results with higher accuracy using the remaining four modems.
My nature, which enjoys challenging itself by saying "Next one!", had overcome yet another hurdle.
5) Distances and Neighborhoods Between Stores
Explaining the location information of a store to a processor that only understands 0s and 1s… Store X and Store Y are next to each other, but X and Z are at completely opposite ends. How would the processor or computer know X, or Y… This part of the project is very fun. You will be very surprised when you read how I came up with the method I used here.
I mentioned in my previous post that I did my internship at a government office. Of course, they didn't just say, "Here, the system is in your hands; write code however you want," and entrust everything to me. I started the internship by testing the company's software and listening to and taking notes on the user experiences (UX) of the people working in this government office who used our software.
Were there any features they wanted? Were there any parts they struggled with or said, "This could be better if this were done differently"? My job was to learn these, take notes, and communicate them to our boss and developer in a language they could understand. Since I was the most successful person in the team in terms of communication, my feedback was important.
While getting feedback from the gentleman in the accounting department (who later gave me socks as a gift, unfortunately I can't remember his name), I noticed he had entered a code into our software. It was something like 150.01.01.06. I asked what it was. He explained that it was a Movable Asset Code List used in accounting to record all materials in the inventory of our state institutions and companies. This list is a system that facilitates inventory tracking by assigning a code to each type of material. Prepared by the Ministry of Treasury and Finance, these codes are used for the management and auditing of movable assets. Let's examine the code I wrote above in more detail:
150: Raw materials and supplies
01: Stationery group
01: Writing instruments
06: Pencils I used a naming structure similar to semantic versioning, based on the Movable Asset Code List. I gave a unique number to the area in front of each store.
That's why I always tell my student brothers and sisters, "Be eager to learn." Don't let internships become a bubble. You never know where you'll learn something or where you'll use that information.
The image below shows a shopping mall corridor. Store 1, Store 2, Store 3, and Store 4 represent the stores. The red lines in the middle indicate the boundaries of the areas in front of the stores. 1.2.2 is the name of the area in front of Store 1, and 1.2.4 is the name of the area in front of Store 2. So, what are these?
1: Floor number
2: Corridor number
1,2,3,4: The stores are named sequentially with even numbers if they are on the right side of the corridor, and odd numbers if they are on the left.
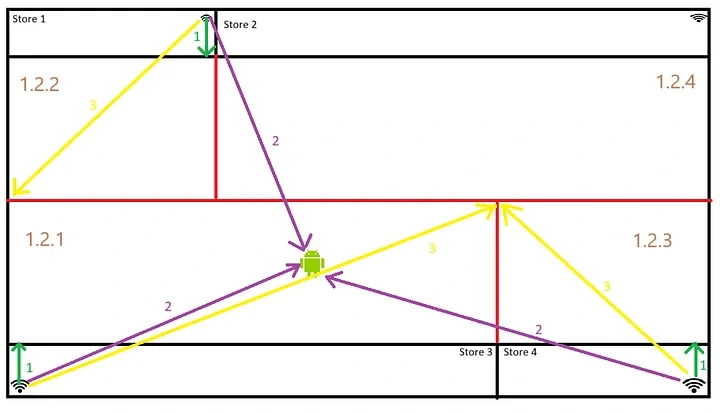
Image by author
The green arrows (numbered 1) show the shortest distances between modems and zones; the purple arrows (numbered 2) show the distances between modems and Android devices; and the yellow arrows (numbered 3) show the longest distances between modems and zones.
The image below shows only the shortest and longest distances from modems to zone coded 1.2.1. Regardless of which modem you use, the distances indicated by arrow 3 are the longest, and the distances indicated by green arrow 1 are naturally the shortest.
Look carefully at both images. The zone that best satisfies the condition 3 > 2 > 1 is where the user is located.
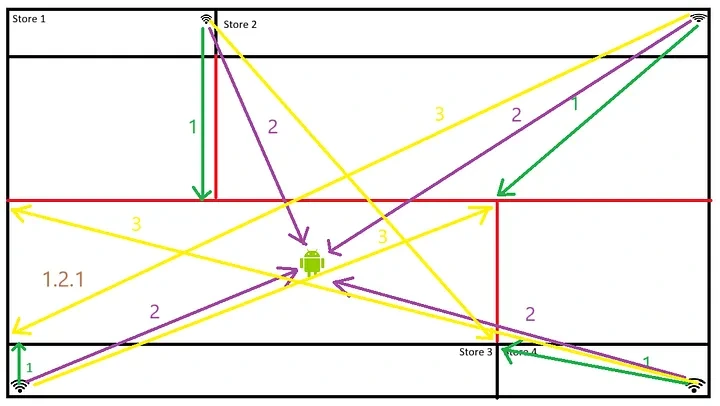
Image by Author
6) Directing the user to the store they want to visit.
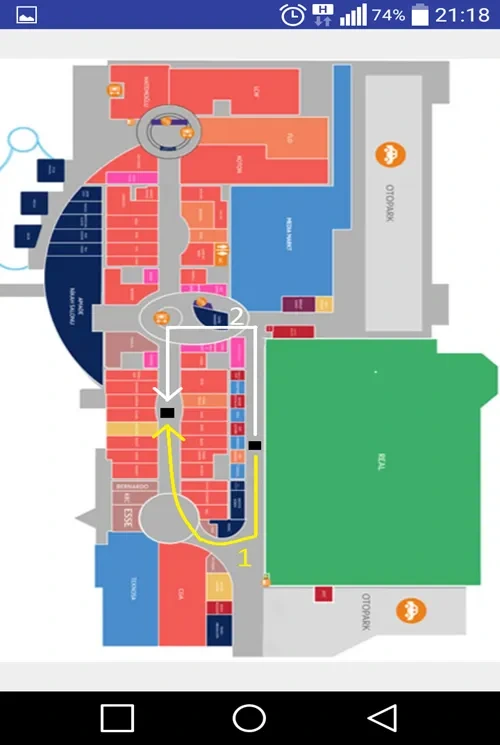
Image by Author
In the screenshot above, both the yellow arrow number 1 and the white arrow number 2 provide directions from one point to another. So which one is shorter? Actually, we could have added a length parameter to each field to calculate the distance in meters. This would have made it easy to calculate the distance from the current location to the desired destination. Unfortunately, we didn't have time to do that. Also, the location of the store entrance would have been included in the calculation. So we only considered the number of stores in between.
In the screenshot below, the user is guided to the desired store by blue dots. You can see how terrible my Android knowledge was at the time. I didn't know anything about SVG or removing the white background. Again, it was 2016, and I had no experience in Android development.
7) Voice Guidance
We've added voice guidance to the app to make it easier for visually impaired users to navigate between stores. The user is guided step-by-step to the store. For example, instructions like "Go four stores ahead, turn right, go five more stores" are given.
8) Potential Improvements
At the end of the project, it was concluded that the application is functional in indoor navigation and location determination, and could be particularly useful for visually impaired users. In the future, we planned to add location-based advertising, statistical analysis, and more advanced location determination techniques like Project Tango instead of optical signage.
Conclusion
This project presents a successful indoor navigation system developed for users who want to navigate shopping malls without getting lost. By using Wi-Fi triangulation technology and naming storefront areas (e.g., 1, 2, 4), it enables users to quickly and accurately determine their location and reach their target stores via the shortest route.
The audio guidance support provided, especially for visually impaired users, makes the project more accessible and useful. Furthermore, the collection and presentation of data on store popularity adds value in terms of shopping mall management and user experience. In the future, with the addition of location-based advertising, advanced mapping techniques, and user feedback, this application can be further developed as an effective and user-friendly solution for indoor spaces.
Looking back, I understand even better how appropriate the solutions we found with the limited resources we had at the time actually were. Absorbing signal strength fluctuations by targeting an area in front of the store instead of a single point, disabling unreliable modems and backing them up with five, creating our own addressing system inspired by the movable code list with a floor.corridor.shop logic, Dijkstra's shortest path algorithm... All of these were solutions we came up with entirely on our own, without university support or budget. Ten years later, if I looked back today, I would still go the same way. Situm, Navigine, Mappedin... None of you existed when we were there.
The English article on this project was 38 pages long. (You're lucky, you managed to get away with just over 2000 words.)
This project was chosen as the university's best project in 2016.
As you can see in the cover photo, Ömür, Taner, and I were given pens with our names engraved on them by the university. I still keep these pens, along with their "chic" box, on my desk as a motivational item. While I'm not particularly proud of the project's code, I'm still very happy that we were able to run such a challenging project with this level of accuracy.
I'm very confident in the methods and algorithms we used. If you have a better graduation project, please write it below so my humble self can benefit.
References
Of course, there are many more sources available now. As you can imagine, I will only mention the sources we used while preparing this article:

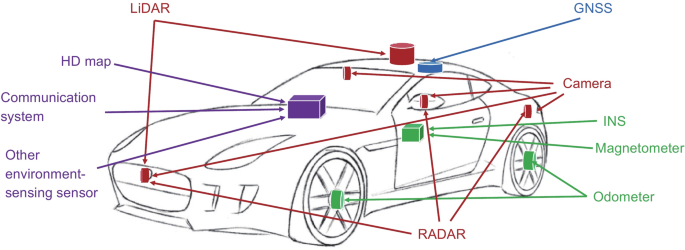
Ten Things You Need to Know About Indoor Positioning Directions Magazine.
Frequently Asked Questions
▸Why was GPS not used for indoor navigation in this project?
GPS doesn't work reliably inside enclosed spaces like shopping malls, airports, or hospitals. The team needed an alternative method, so they used existing Wi-Fi modems and signal strength calculations to determine the user's location indoors.
▸What formula was used to calculate distance from Wi-Fi signal strength?
The team used the Free Space Path Loss (FSPL) formula, which derives distance in meters from signal strength measured in decibels and frequency in Hertz. Testing showed the formula had roughly 60–70% accuracy due to natural variability in Wi-Fi signal strength.
▸Why did the team use Wi-Fi modems instead of Bluetooth beacons?
Bluetooth beacons required one unit per 5–6 square meters, costing around $5–10 each, and the university wouldn't fund the expense. Battery maintenance and the lack of a formal company structure made beacons impractical, so the team relied on existing Wi-Fi modems instead.