
From Android to Vue.js: VSCode, Challenges, and Solutions
- Device Mode in Browser is Just an Illusion
- How to Enable Developer Mode and USB Debugging
- How to Run a Vue.js-Quasar Project on a Real Android Device
- Running a Vue.js Quasar Project on an Android Device Without Android Studio
- Build the Project with Quasar:
- Synchronize the Build with Capacitor
- Connect the Android Device with ADB
- Install the App on the Device
- Run the App on the Device
- Running a Vue.js Quasar Project on an Android Device Using Android Studio
- After Installing the App, Use Logcat for Real-Time Monitoring
- Android Profiler
- Viewing Console Output and Errors
- 1. Connect the Device Through Chrome:
- 2. Select Your App:
- 3. Console.log and Error Messages:
- 4. Real-Time Debugging:
- Extra Tips:
- Comparing Android and Vue.js Lifecycle
- 1. Application vs. Component-Based Structure
- 2. Context Difference
- 3. State and Data Management
- 4. Asynchronous Operations and API Calls
- 5. Memory Management
- From Emulator to Browser: Live Reload (HMR: Hot Module Replacement)
- Gradle vs. Quasar CLI: Build Processes
- Transitioning from XML to Vue.js Templates
- My Adjustments with Visual Studio Code
- Conclusion
Contents
- Device Mode in Browser is Just an Illusion
- How to Enable Developer Mode and USB Debugging
- How to Run a Vue.js-Quasar Project on a Real Android Device
- Running a Vue.js Quasar Project on an Android Device Without Android Studio
- Build the Project with Quasar:
- Synchronize the Build with Capacitor
- Connect the Android Device with ADB
- Install the App on the Device
- Run the App on the Device
- Running a Vue.js Quasar Project on an Android Device Using Android Studio
- After Installing the App, Use Logcat for Real-Time Monitoring
- Android Profiler
- Viewing Console Output and Errors
- 1. Connect the Device Through Chrome:
- 2. Select Your App:
- 3. Console.log and Error Messages:
- 4. Real-Time Debugging:
- Extra Tips:
- Comparing Android and Vue.js Lifecycle
- 1. Application vs. Component-Based Structure
- 2. Context Difference
- 3. State and Data Management
- 4. Asynchronous Operations and API Calls
- 5. Memory Management
- From Emulator to Browser: Live Reload (HMR: Hot Module Replacement)
- Gradle vs. Quasar CLI: Build Processes
- Transitioning from XML to Vue.js Templates
- My Adjustments with Visual Studio Code
- Conclusion
Image prepared by Canva.
Welcome! I talked about my Vue.js journey in different posts, like here and here. So please go read them, give a clap, and then come back. 😊
Between May 2017 and October 2018, I worked as a junior Android developer at Protel. We did some great projects, and I learned a lot. Back then, I wasn’t interested in frontend or backend. Frontend felt like a different world, and backend was just a “data provider” that we depended on. :) My main focus was to get better in my own field. But I worked closely with some of the people who introduced Vue.js to Turkey, and I often heard their praise for it. This made me curious about Vue.js.
As I mentioned in this article, I never thought I’d get tired of Android and look for something new. So, with my old curiosity about Vue.js, moving from Android to Vue.js was even more exciting.
At first, I expected my Kotlin and Android Studio habits to work in Vue.js and Visual Studio Code. Different IDEs, different languages, different setups… I learned a lot along the way, making many comparisons and connections. So, without making it any longer, let’s get into it.
Device Mode in Browser is Just an Illusion
First of all, as I detailed in this post, I should properly test how Mevbank Neo looks on a real Android device, check for any issues specific to Android, and fix any errors or misalignments. One of the main tools that frontend developers use to test how their web application looks on different devices is the Device Mode feature.
Device Mode is a feature used to “simulate” a website on various devices. After opening the Developer Tools (Dev Tools), you can activate this mode by clicking the “Toggle Device Mode” button at the top left of the open panel. This simulates the screen size, resolution, and pixel density of the selected device. Mobile features like touch events and network speed can also be tested. This helps you quickly evaluate how your website will look and function across different devices.
However, this simulation is not a real device screen; it’s just a basic frame that mimics the sizing within the browser — it’s not even an emulator. Capacitor does not activate. Code snippets like $q.platform.is.capacitor do not work in this device mode. So don’t think of it as a real device; it’s just a display. Personally, I only use it for a quick check on the UI to see how it would look on mobile devices.
This is the mode I’m talking about:
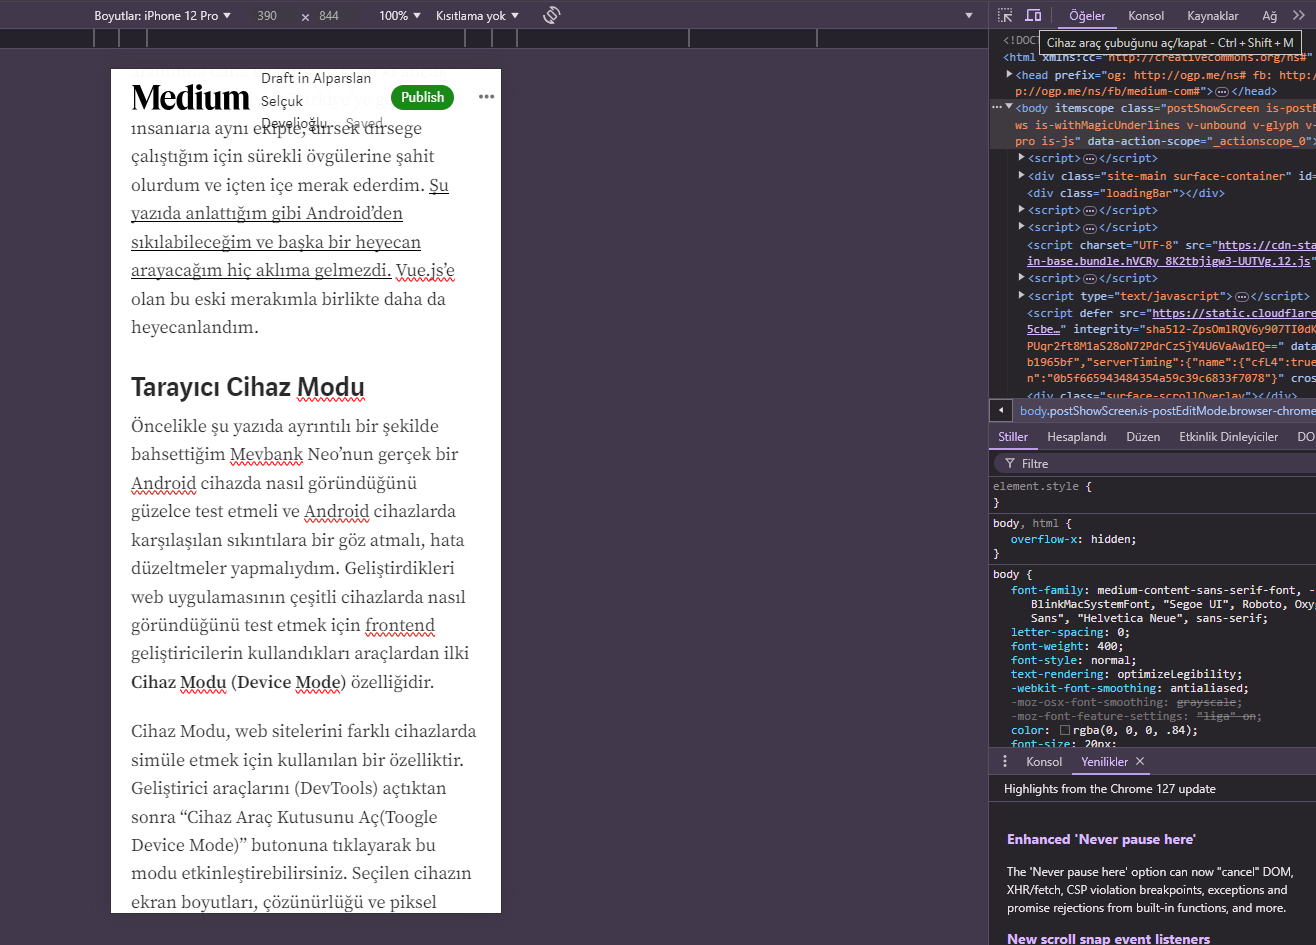
Screenshot by author.
How to Enable Developer Mode and USB Debugging
To use a real Android device, you need to enable USB debugging from the developer options on your device. Don’t worry; this won’t harm your phone or data. Here’s how to do it:
Go to Settings > About Phone on your Android device.
Tap on Build Number seven times to enable developer mode.
After entering developer mode, go to Settings > Developer Options and turn on USB Debugging.
How to Run a Vue.js-Quasar Project on a Real Android Device
To run a Vue.js-Quasar project on an Android device, first, we need to set up an Android project within the root directory using Capacitor. I explained Capacitor in detail in this post as well. Run these commands in the terminal:
To add Capacitor to the project:
quasar mode add capacitorAdd the Android Platform to the Project:
npx cap add androidAfter installing Capacitor and adding the Android platform to the project, we have two options for running a Vue.js-Quasar project on an Android device: using Android Studio or not. My personal preference is, of course, the version where we use Android Studio.
Running a Vue.js Quasar Project on an Android Device Without Android Studio
You can run your app on your device using ADB (Android Debug Bridge) without Android Studio. To have your computer recognize the device connected via USB, we need ADB. I explained ADB in detail in this post.
Build the Project with Quasar:
After this command, an APK file will be created in the android/app/build/outputs/apk/debug/ directory.
quasar build -m capacitor -T androidSynchronize the Build with Capacitor
Sync the built Quasar files with the Capacitor project:
npx cap sync androidConnect the Android Device with ADB
Connect your device to your computer via USB and check if ADB recognizes it:
Install the App on the Device
After the APK is created, you can install it on your device with ADB:
adb install android/app/build/outputs/apk/debug/app-debug.apkOr, you can open the directory where the APK file is located with the cd command in the terminal and just run:
adb install app-debug.apkRun the App on the Device
To start the installed APK on your device:
adb shell am start -n com.yourapp.package/com.yourapp.package.MainActivityRunning a Vue.js Quasar Project on an Android Device Using Android Studio
Running your project on a real device using Android Studio is very helpful, especially for advanced debugging, simulation, and performance testing. First, download “our trusty tool” (Android Studio) from here.
After adding the Android platform with Capacitor as described in the previous steps, open Android Studio and import the Android folder in the root directory of your project. This allows Android Studio to recognize your project, automatically load the necessary configurations, and download packages via Gradle.
Connect your device to your computer via USB and make sure that “USB Debugging” is enabled in the developer options.
In Android Studio, click the “Run” button to install and run your app on your device.
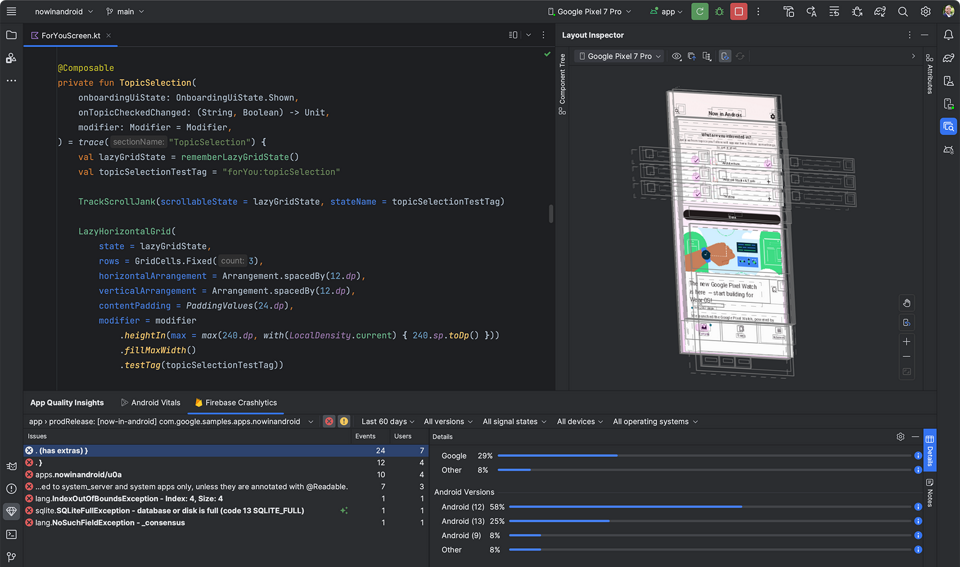
Taken from Android’s official website.
After Installing the App, Use Logcat for Real-Time Monitoring
Once your app is installed, you can watch its output and errors live in the Logcat screen in Android Studio. This helps you optimize the app’s performance and quickly identify and fix any issues.
Logcat is great — we love it. It shows incoming notifications, errors, and even console.log messages for our mobile app. There’s also the “Android Profiler” and it’s simply fantastic.
Android Profiler
Android Profiler is a performance monitoring tool within Android Studio. It lets you analyze various performance metrics of your app, such as CPU, memory, network, and battery usage. Here’s what each tool in Android Profiler does:
CPU Profiler: Monitors your app’s CPU usage, showing which processes consume the most resources and which tasks the main thread is focused on. You can track thread activities and find performance bottlenecks.
Memory Profiler: Tracks your app’s memory usage to help you identify issues like memory leaks. It shows which objects take up memory and lets you observe the efficiency of memory management. For example, if you send a request during a page transition, you can clearly see how much memory the response uses. This is useful even if your app is a webview. You can see the impact of nested loops on memory usage.
Network Profiler: Monitors network requests, measuring data transfer amounts and speed. It shows how your app uses the internet connection and helps you determine if optimization is needed.
Energy Profiler: Tracks energy consumption to see how it impacts battery life. This is crucial for optimizing battery usage on mobile devices.
This tool is powerful and useful for analyzing and optimizing even cross-platform webview apps’ performance. You don’t have to use Android Studio to run a Vue.js Quasar app on a device, but if you want a more efficient development process, it’s definitely recommended.
Viewing Console Output and Errors
After running your Vue.js and Quasar project on an Android device, one of the best tools for viewing console outputs and debugging is Chrome DevTools. To debug your app on the Android device through the browser, follow these steps:
1. Connect the Device Through Chrome:
Connect your device to the computer via USB, then open chrome://inspect/#devices in your browser. On this page, you can see connected devices and the webviews running on the device.
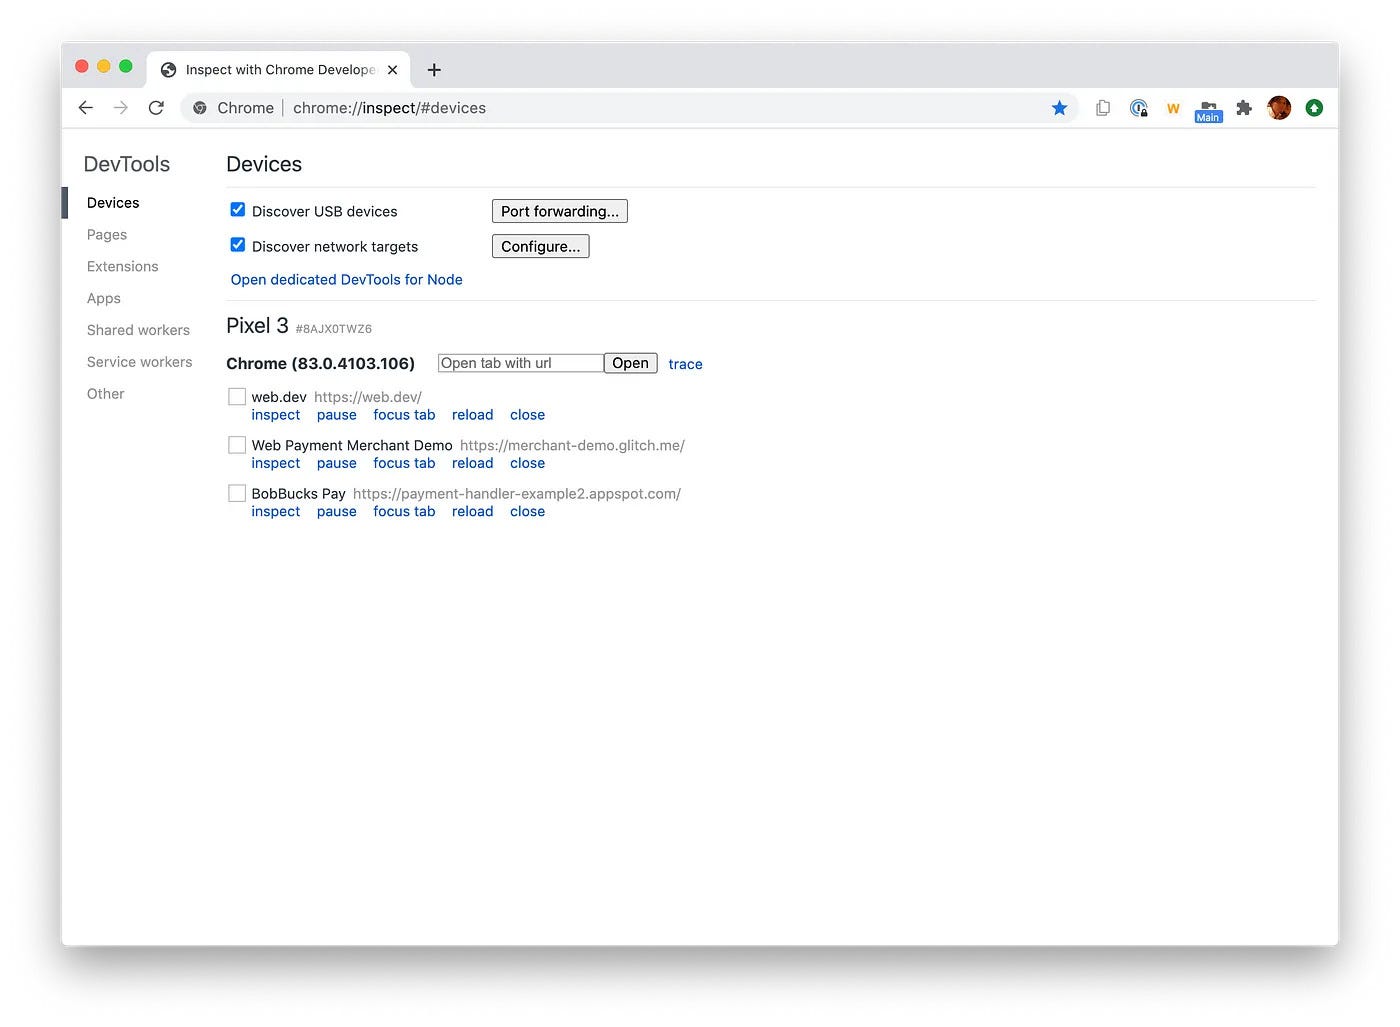
Screenshot by author
2. Select Your App:
Here, you’ll see the connection for your Vue.js Quasar app. Next to it, there’s an “Inspect” button. Click this button to open Chrome DevTools, where you can access the console and debugging tools for your app.
3. Console.log and Error Messages:
The console shows your app’s console.log() messages, errors, and other outputs. You can monitor API calls, commands, responses, and error messages here.
4. Real-Time Debugging:
In Chrome DevTools, you can instantly inspect any part of your Vue.js app, review console.log() outputs, and debug. You can interact with your app’s components and data directly, find the sources of errors, and fix them.
Extra Tips:
Network and Performance Tabs: Use the Network tab to see all HTTP requests made by your app over the internet. You can review the time taken for each request and check for any errors in detail.
Breakpoints and Debugging: In the Sources tab, you can set breakpoints in your code. This allows you to pause execution at specific lines and debug step-by-step.
Vue DevTools: Install the Vue DevTools extension for Chrome to inspect Vue components and state management in real-time. With this extension, you can deeply analyze your Vue.js app’s data, lifecycle hooks, and component structure.
Comparing Android and Vue.js Lifecycle
Android Lifecycle: In Android apps, methods like onCreate(), onResume(), onPause() control the lifecycle of an Activity or Fragment. These methods allow us to perform necessary actions at specific stages of the app.
Vue.js Lifecycle Hooks: In Vue.js, lifecycle hooks manage the lifecycle of components, with methods like mounted(), created() and updated() controlling when a component is created, updated, or destroyed. This is similar to Android but has some differences specific to the web environment.
1. Application vs. Component-Based Structure
Android Lifecycle: In Android, lifecycle methods manage the lifecycle of application-level structures like Activities or Fragments. These structures impact the overall app, whether or not they are linked to a user interface. Thus, creating, pausing, or ending Activities or Fragments affects the entire app process.
Vue.js Lifecycle: In Vue.js, lifecycle methods operate at the component level. Each component has its own lifecycle, impacting only that part of the page. Each component has an independent lifecycle, allowing them to be managed without dependency on each other.
2. Context Difference
Android: Android lifecycle methods apply to large-scale components like Activities or Fragments, meaning that when onCreate() is called, it affects a large part of the app. The context is at an application level, tightly connected with UI and backend operations.
Vue.js: In Vue.js, lifecycle hooks control only the component’s specific HTML, CSS, and JS. Vue components operate within a smaller DOM scope, and their lifecycle is independent of others. Vue components can be nested, and the lifecycle of one does not affect another.
3. State and Data Management
Android: In Android, data (state) within an Activity or Fragment is often managed with bundles or a view model in methods like onCreate() and onResume(). When the app is paused and resumed, the onSaveInstanceState() method saves and restores data. This makes state management complex. (Yes, MVVM exists, but that’s not the focus here.)
Vue.js: State and data management in Vue.js is simpler. Data is stored in the data() function of components, and Vue’s reactivity system updates the component instantly with each data change. Global state management tools like Vuex or Pinia can also be used, meaning state changes are handled automatically without manual state recovery.
4. Asynchronous Operations and API Calls
Android: API calls and other async tasks are often done in lifecycle methods, like in onCreate() or onResume(). However, you must check if the Activity is still active when the API response returns, as the Activity or Fragment might have already ended.
Vue.js: Similarly, async tasks (API calls, timers, etc.) are typically done in lifecycle hooks like mounted() or created(). These tasks are performed after the component is loaded into the DOM, and Vue’s reactivity system manages the state when the component is removed, eliminating the need to cancel the task manually.
5. Memory Management
Android: Memory leaks are a common issue in Android. If an Activity’s lifecycle isn’t managed correctly, it can stay in memory after closing, causing unnecessary memory usage. It’s important to clean up resources manually in onDestroy()
Vue.js: Vue.js is efficient with memory management. When a Vue component is removed from the DOM, its data, event listeners, and async operations are automatically cleaned up, typically via the onDestroy() lifecycle hook. Manual intervention is rarely needed.
From Emulator to Browser: Live Reload (HMR: Hot Module Replacement)
In Android Studio, when build ing your app and running it on a device, you typically need to restart the app after each change. While recent Android Studio versions and Compose have tried to improve this, how many of us really trust it? We still feel more confident in restarting.
In Quasar, however, the browser has a live reload feature (HMR), which makes things much faster. HMR instantly reflects any changes made in the project within the browser, so there’s no need to constantly build and deploy. This feature saves a lot of time, especially during UI development.
Gradle vs. Quasar CLI: Build Processes
Gradle: In Android Studio, Gradle provides a powerful setup for dependency management, modular structure, and project builds. The modular structure in Gradle is an advantage even iOS doesn’t offer. In Android, each module sees others only as libraries, so once a module is compiled, it doesn’t need to recompile unless the code changes. This effectively optimizes build times in large projects. Additionally, Gradle’s automatically generated
Rfile offers easy access to resources (icons, images, colors, static text) with shortcuts likeR.icon.Vue.js and Quasar CLI: Quasar CLI makes the build process straightforward and fast in Vue.js projects. Features like Hot Module Replacement (HMR) update only the modified sections instead of rebuilding the entire project, greatly speeding up the workflow. However, Quasar lacks the modular structure of Gradle, which may not provide the same flexibility for large projects. In Vue.js, accessing a file requires manual imports, so there’s no centralized access convenience like Android’s
Rfile.
Transitioning from XML to Vue.js Templates
I covered this difference in detail in this post. While Android projects use XML to define layouts, Vue.js projects use an HTML-like template structure. Quasar framework’s built-in components make UI development much faster. For example, creating a button or form is quick with Quasar components, allowing you to build interactive user interfaces in no time.
<template>
  <q-btn label="Gönder" color="primary" @click="sendMessage" />
</template>
This example is quite similar to the Button component in Android, but working in an HTML-based structure in Vue.js speeds up the design and development processes.
My Adjustments with Visual Studio Code
When I switched from Android Studio to Visual Studio Code, the first thing I did was add the Double Shift feature I often used in Android Studio. In Android Studio, pressing double shift allowed me to quickly search for files and classes. Moving to VS Code, I tried to replicate this with “Go to File” (Ctrl+P) and “Quick Open” It doesn’t feel exactly the same, but it gets the job done.
I struggled a bit with the comment shortcut. Android Studio detects whether the selected text is already a comment and automatically comments or uncomments it with a shortcut key. In VS Code, I use Ctrl+7 to uncomment and Ctrl+6 to comment a line.
In Android Studio, I could duplicate the line I was on with Ctrl+D. In VS Code, the equivalent is Shift+Alt+Down to copy a line, but old habits die hard — so I remapped it to Ctrl+D. Quick Search in Code (Find in Path) is Ctrl+Shift+F in both, so thanks, team!
Debugging Vue.js Quasar projects in Visual Studio Code is straightforward. You can debug directly with Chrome or Edge, setting breakpoints to inspect the code step-by-step. I’ll share a more detailed guide on this soon, but for now, you can start debugging in the browser by setting up your launch.json file like this:
{
  "version": "0.2.0",
  "configurations": [
    {
      "type": "chrome",
      "request": "launch",
      "name": "Quasar: Launch Chrome",
      "url": "http://localhost:8080",
      "webRoot": "${workspaceFolder}/src",
      "sourceMaps": true,
      "breakOnLoad": true,
      "skipFiles": ["<node_internals>/**"],
      "trace": true
    }
  ]
}
Conclusion
Switching from Android to Vue.js and Quasar may seem intimidating at first, but it allows you to develop projects faster over time. Gradle’s modular structure and the convenience of the R file may be missed, but Quasar CLI and HMR make it possible to develop projects more flexibly and quickly. Additionally, Vue.js’s component-based structure and lifecycle hooks are as powerful and functional as Android’s Fragment management.
Frequently Asked Questions
▸Why is Device Mode in the browser not enough for mobile testing?
Device Mode in the browser is described as 'just an illusion' — it simulates screen sizes but doesn't replicate real device behavior. Testing on an actual Android device reveals true performance, touch behavior, and hardware-specific issues that the browser cannot reproduce.
▸How do you enable Developer Mode and USB Debugging on Android?
The post covers enabling Developer Mode and USB Debugging as a prerequisite for connecting an Android device for testing. These settings allow ADB to communicate with the device from your development machine.
▸How do you run a Quasar Vue.js project on a real Android device without Android Studio?
You build the project with Quasar CLI, synchronize the build with Capacitor, connect the Android device via ADB, then install and run the app directly on the device. This workflow avoids needing Android Studio entirely.
▸How do you run a Quasar Vue.js project on Android using Android Studio?
After setting up the Capacitor sync, you open the project in Android Studio and deploy it to the connected device. You can then use Logcat for real-time monitoring and the Android Profiler for performance analysis.
▸How can you view console.log output and errors from a Vue.js app running on Android?
Connect the device through Chrome's remote debugging tools, select your app, and you can view console.log messages, errors, and perform real-time debugging just like you would in a desktop browser.
▸What is the role of Capacitor in a Quasar Vue.js Android workflow?
Capacitor is used to synchronize the Quasar build output so it can be packaged and run as a native Android app. It bridges the web project and the native Android runtime.
▸How does the Android lifecycle compare to the Vue.js component lifecycle?
The post compares Android's application-level lifecycle to Vue.js's component-based structure, noting differences in context, state management, asynchronous operations, and memory management between the two paradigms.
▸What is the Vue.js equivalent of the Android emulator's live reload?
Vue.js uses Hot Module Replacement (HMR) in the browser, which live-reloads changes instantly during development — similar in purpose to live reload in an Android emulator but faster and browser-based.
▸How does Quasar CLI compare to Gradle for building projects?
The post draws a parallel between Gradle (Android's build tool) and Quasar CLI, noting that Quasar CLI handles the build process for Vue.js projects in a comparable role, allowing developers to build and serve the app from the command line.
▸How does XML layout in Android translate to Vue.js templates?
Android developers use XML files to define UI layouts, while Vue.js uses single-file component templates with HTML-like syntax. The post covers adjustments needed when transitioning from XML-based UI design to Vue.js templates.
▸How do you set up browser debugging for a Quasar app in VS Code?
You configure a launch.json file in VS Code with a Chrome launch configuration pointing to localhost:8080, enabling source maps and breakpoints. The post provides a ready-to-use launch.json snippet for this setup.
▸Is switching from Android development to Vue.js difficult?
The author says it can seem intimidating at first but becomes faster over time. Their Android background actually added useful habits around device testing, debugging, and lifecycle thinking that transferred well to Vue.js.